Spotify Wrapped, But for Your Team’s Work
GitHub Repository: https://github.com/conmeara/airtable-year-end-wrap
Every December, Spotify Wrapped takes over social media. People love seeing their year distilled into beautiful, shareable stats. I wanted to bring that same experience to teams using Airtable for time tracking and project management.
The result is a custom Airtable Block that transforms your work data into 12 animated slides—complete with confetti, sparkles, and personalized achievements.
What You Get
- 12 animated slide templates - Beautiful, personalized stats for each team member
- 30+ CSS animations - Confetti, sparkles, floating orbs, word reveals, and more
- Stats calculation engine - Aggregate hours, projects, clients, and collaborators
- Achievement/badge system - Automatically detect milestones and superlatives
- AI-assisted customization - Export your schema and let Claude or Cursor adapt the code
The 12 Slides
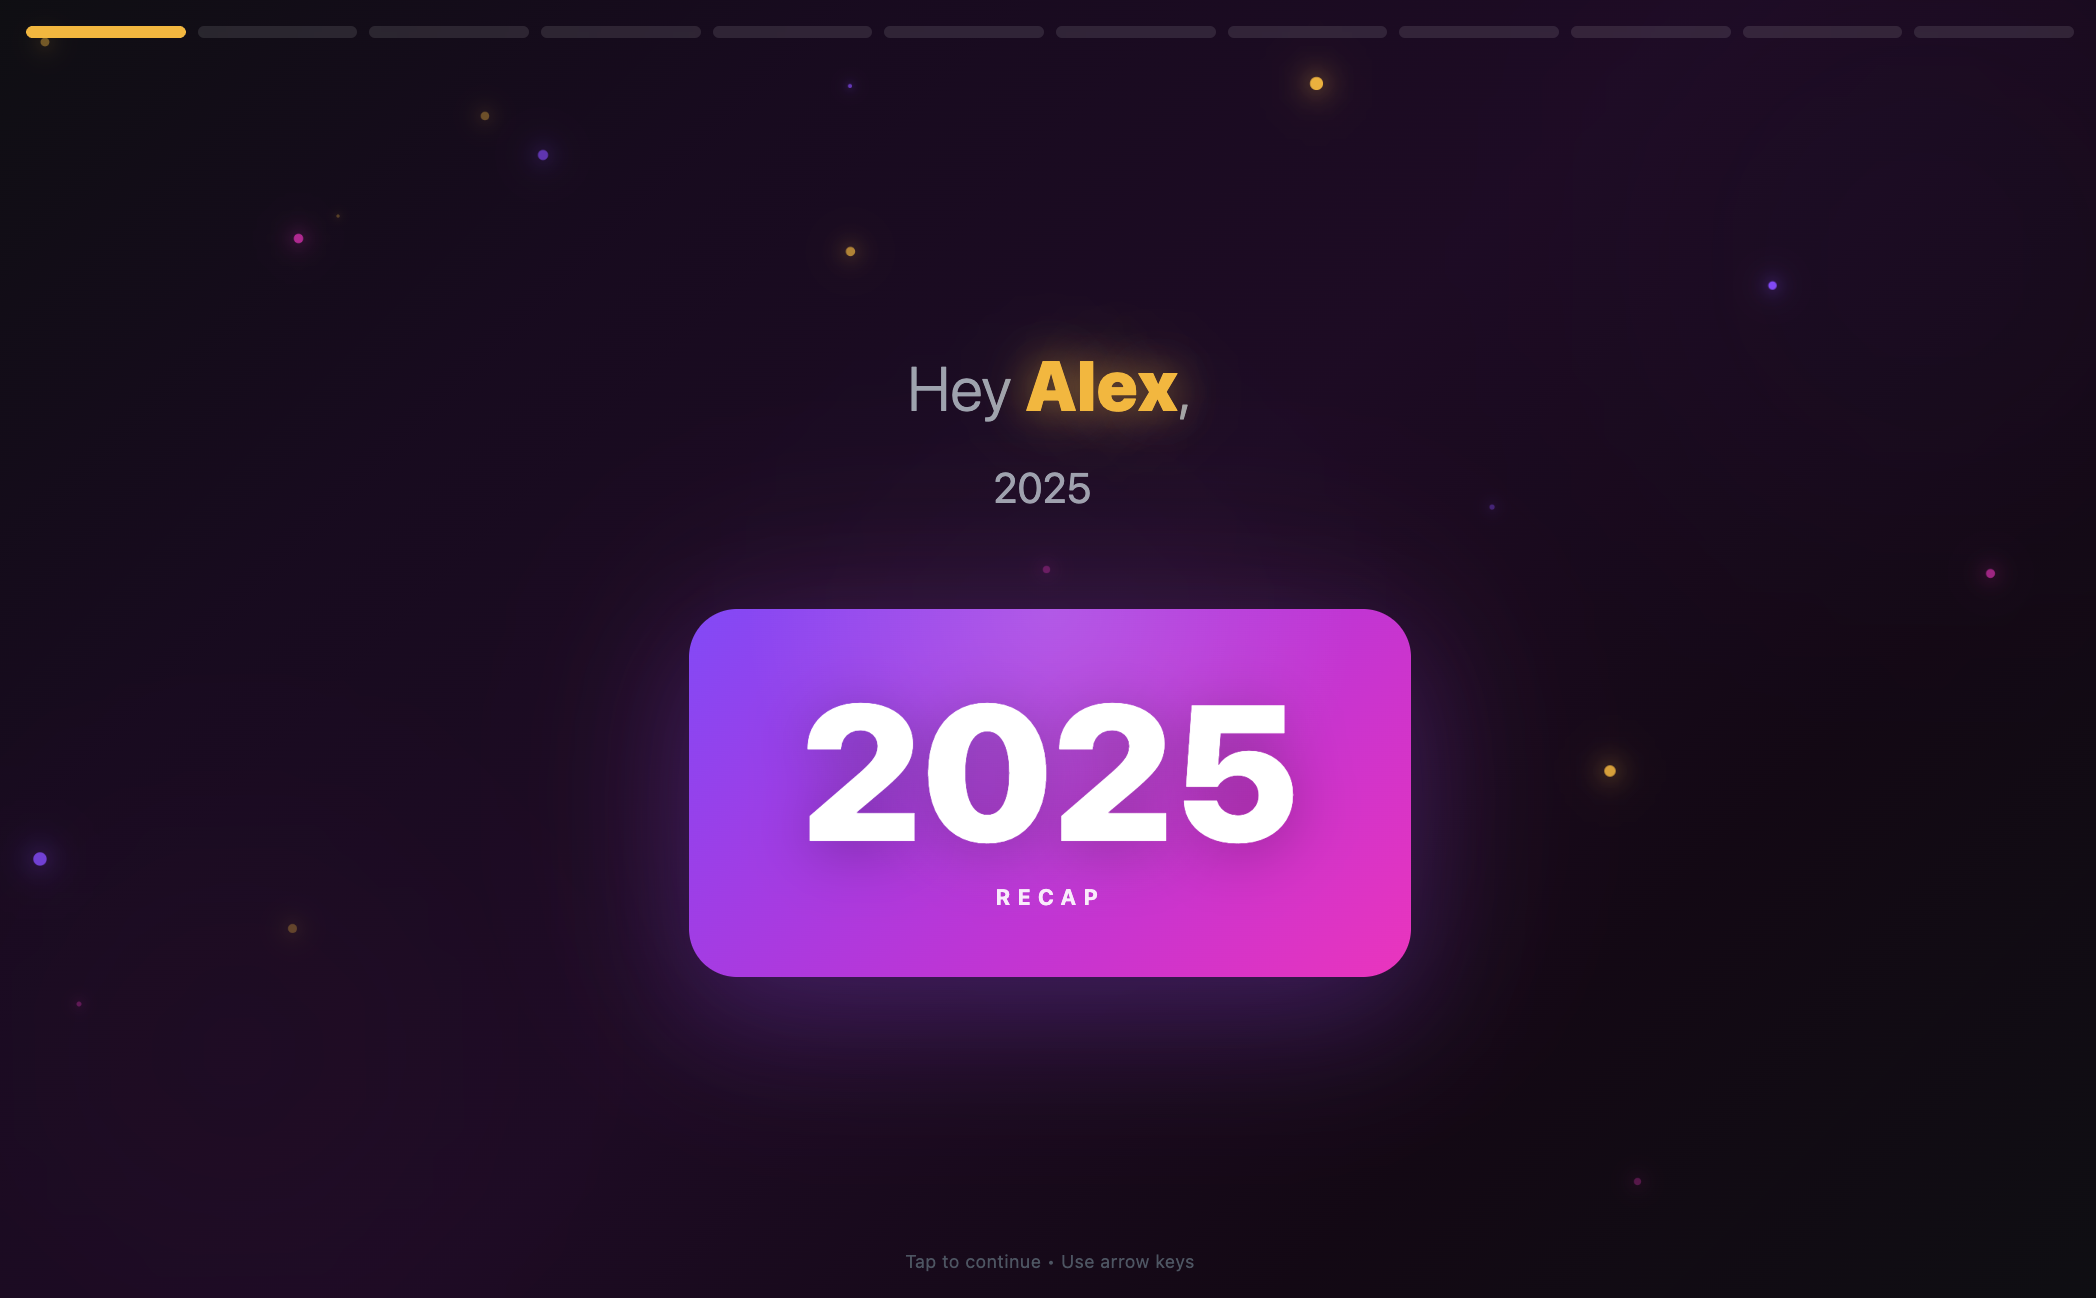
1. Cold Open
Personalized greeting with the user’s name, animated word reveal, and ambient floating orbs. Sets the tone for the year-end experience.
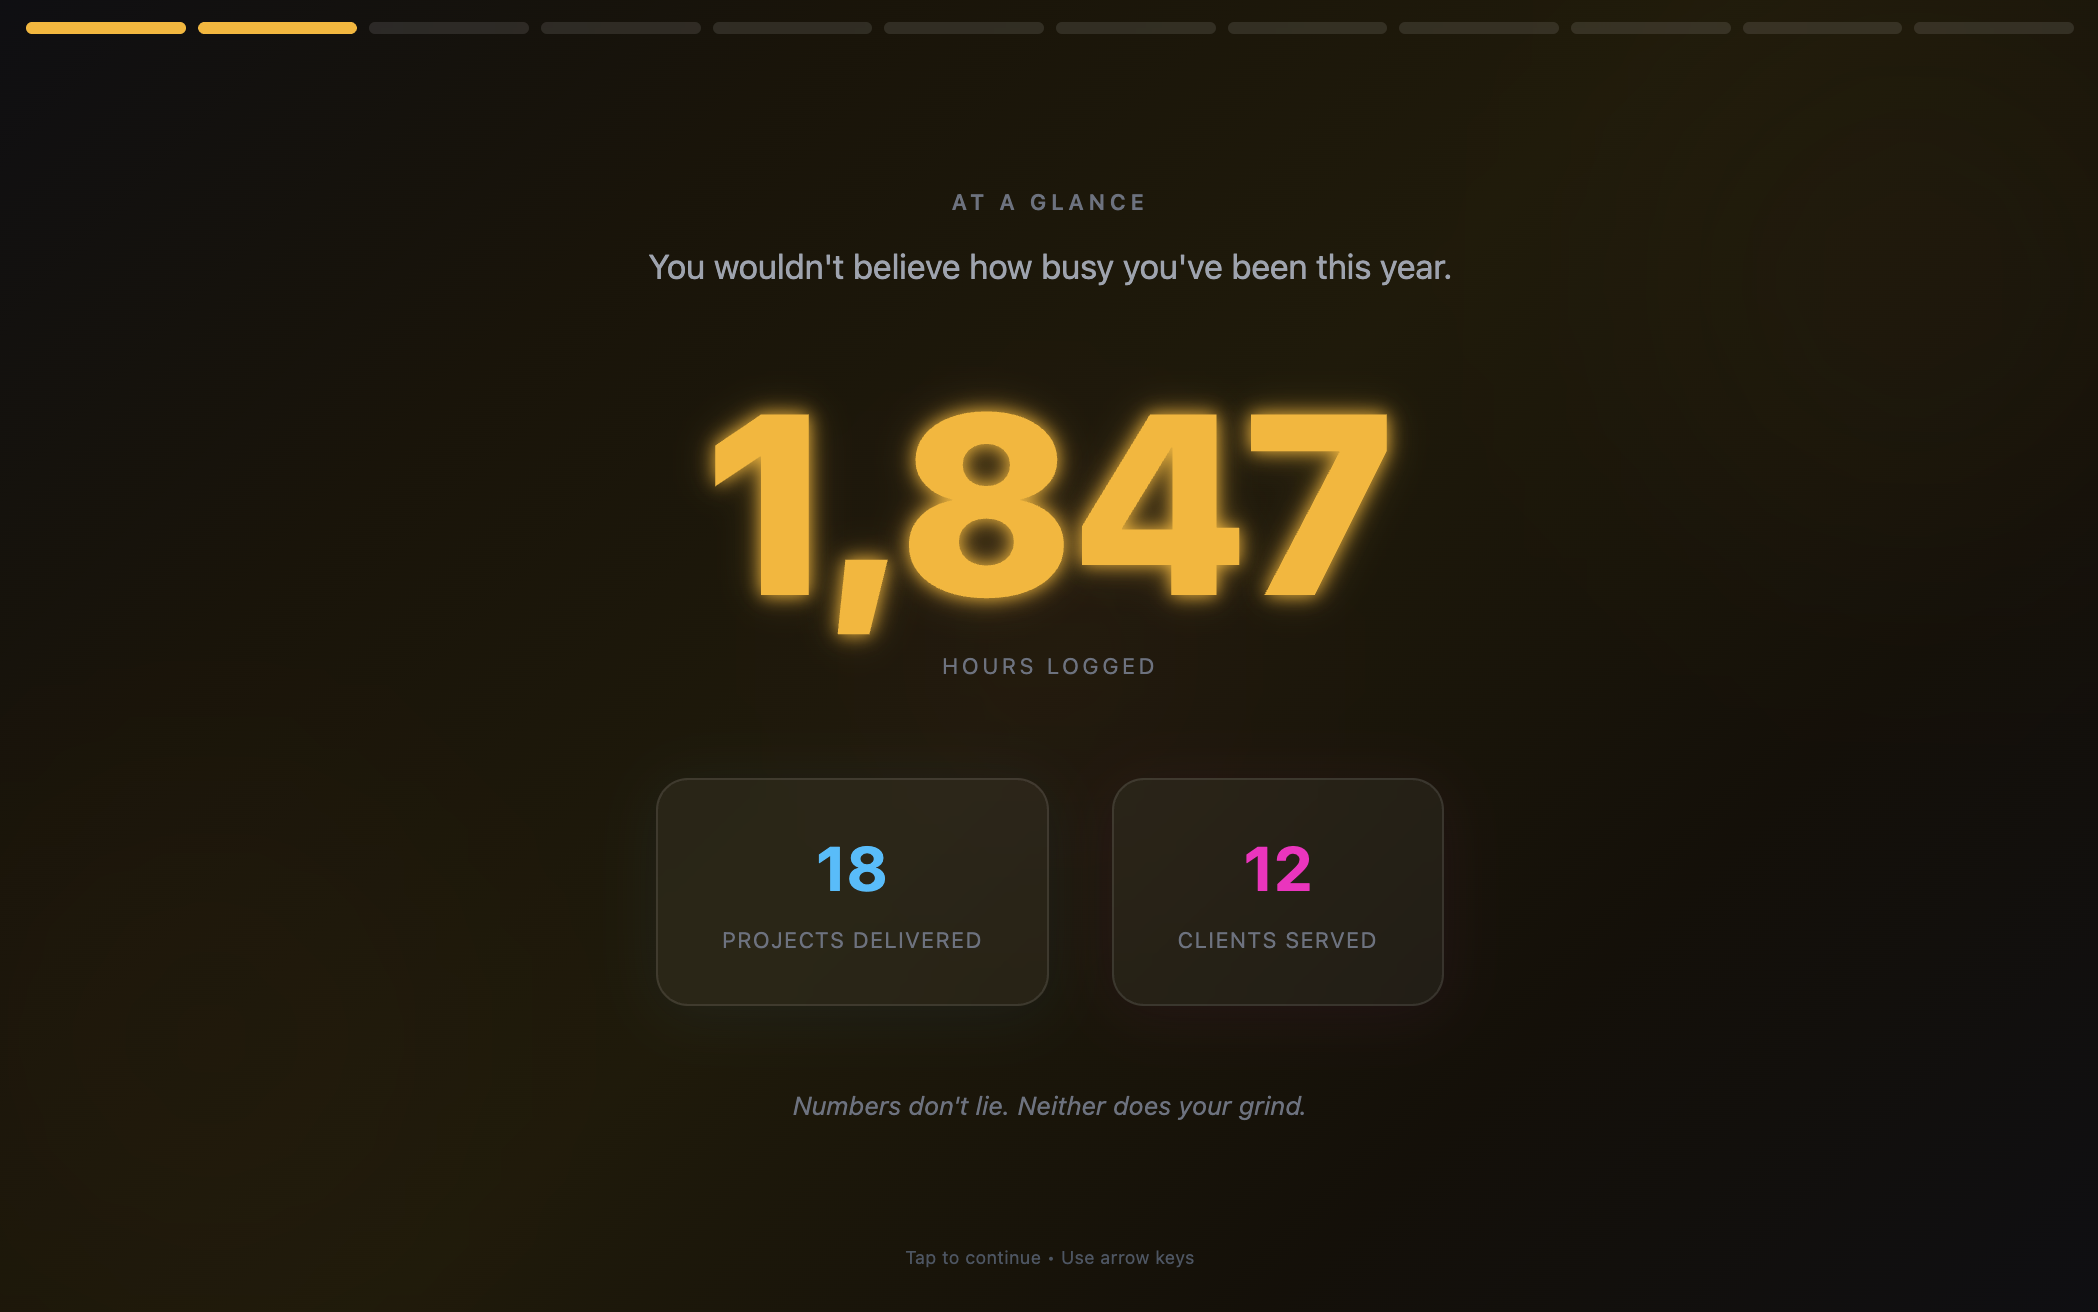
2. At a Glance
Key metrics displayed in a bento grid layout. Shows total hours worked, number of projects, clients served, and team size with animated counters.
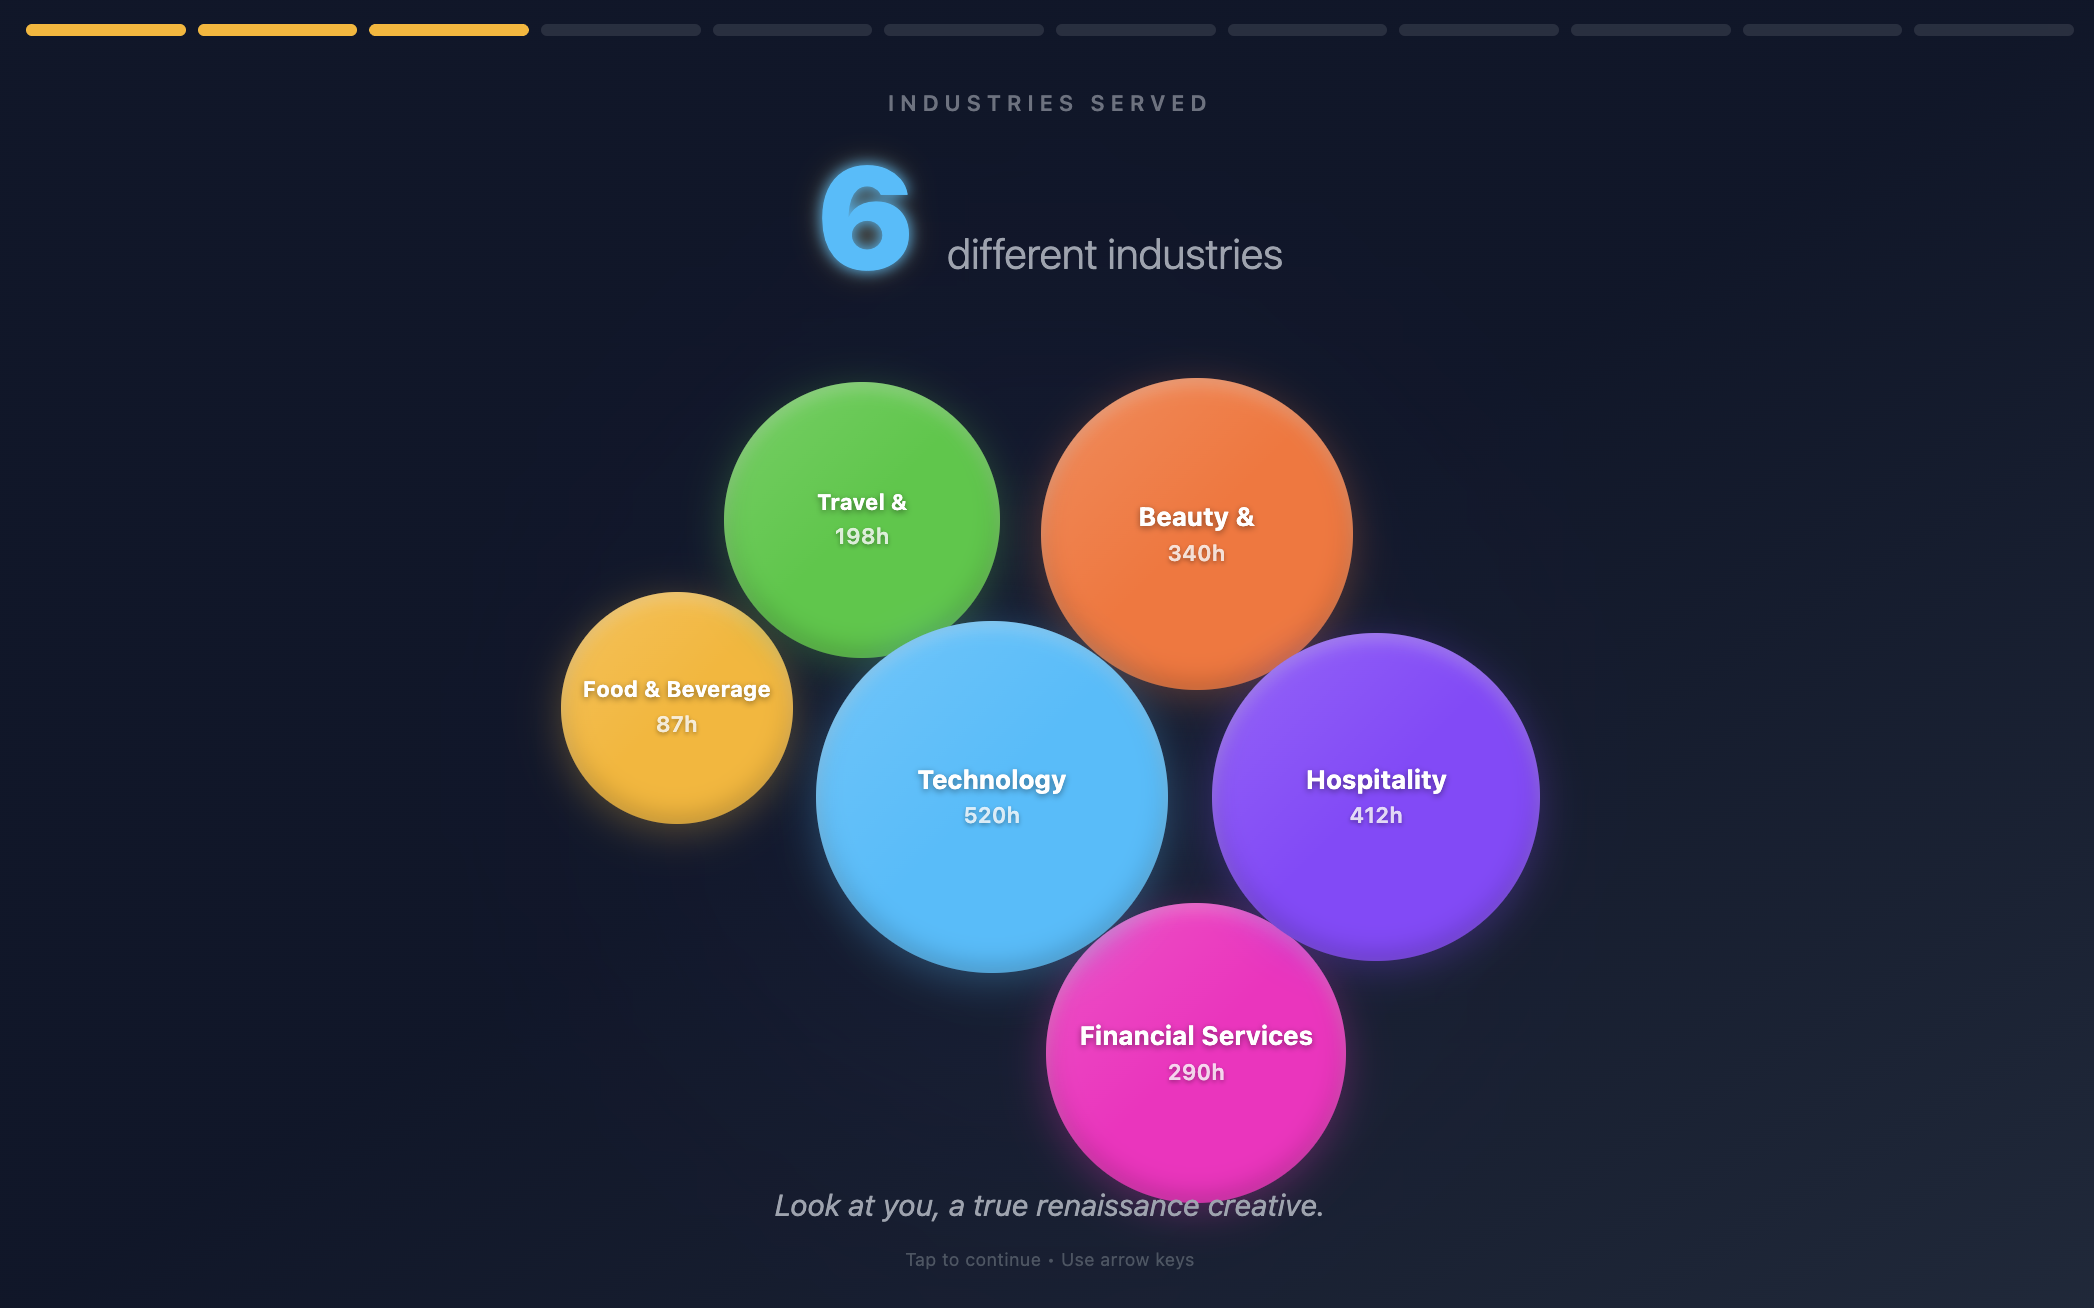
3. Industries
Circle-packed bubble visualization showing hours spent across different industries. Larger bubbles = more hours. Hover for project details.
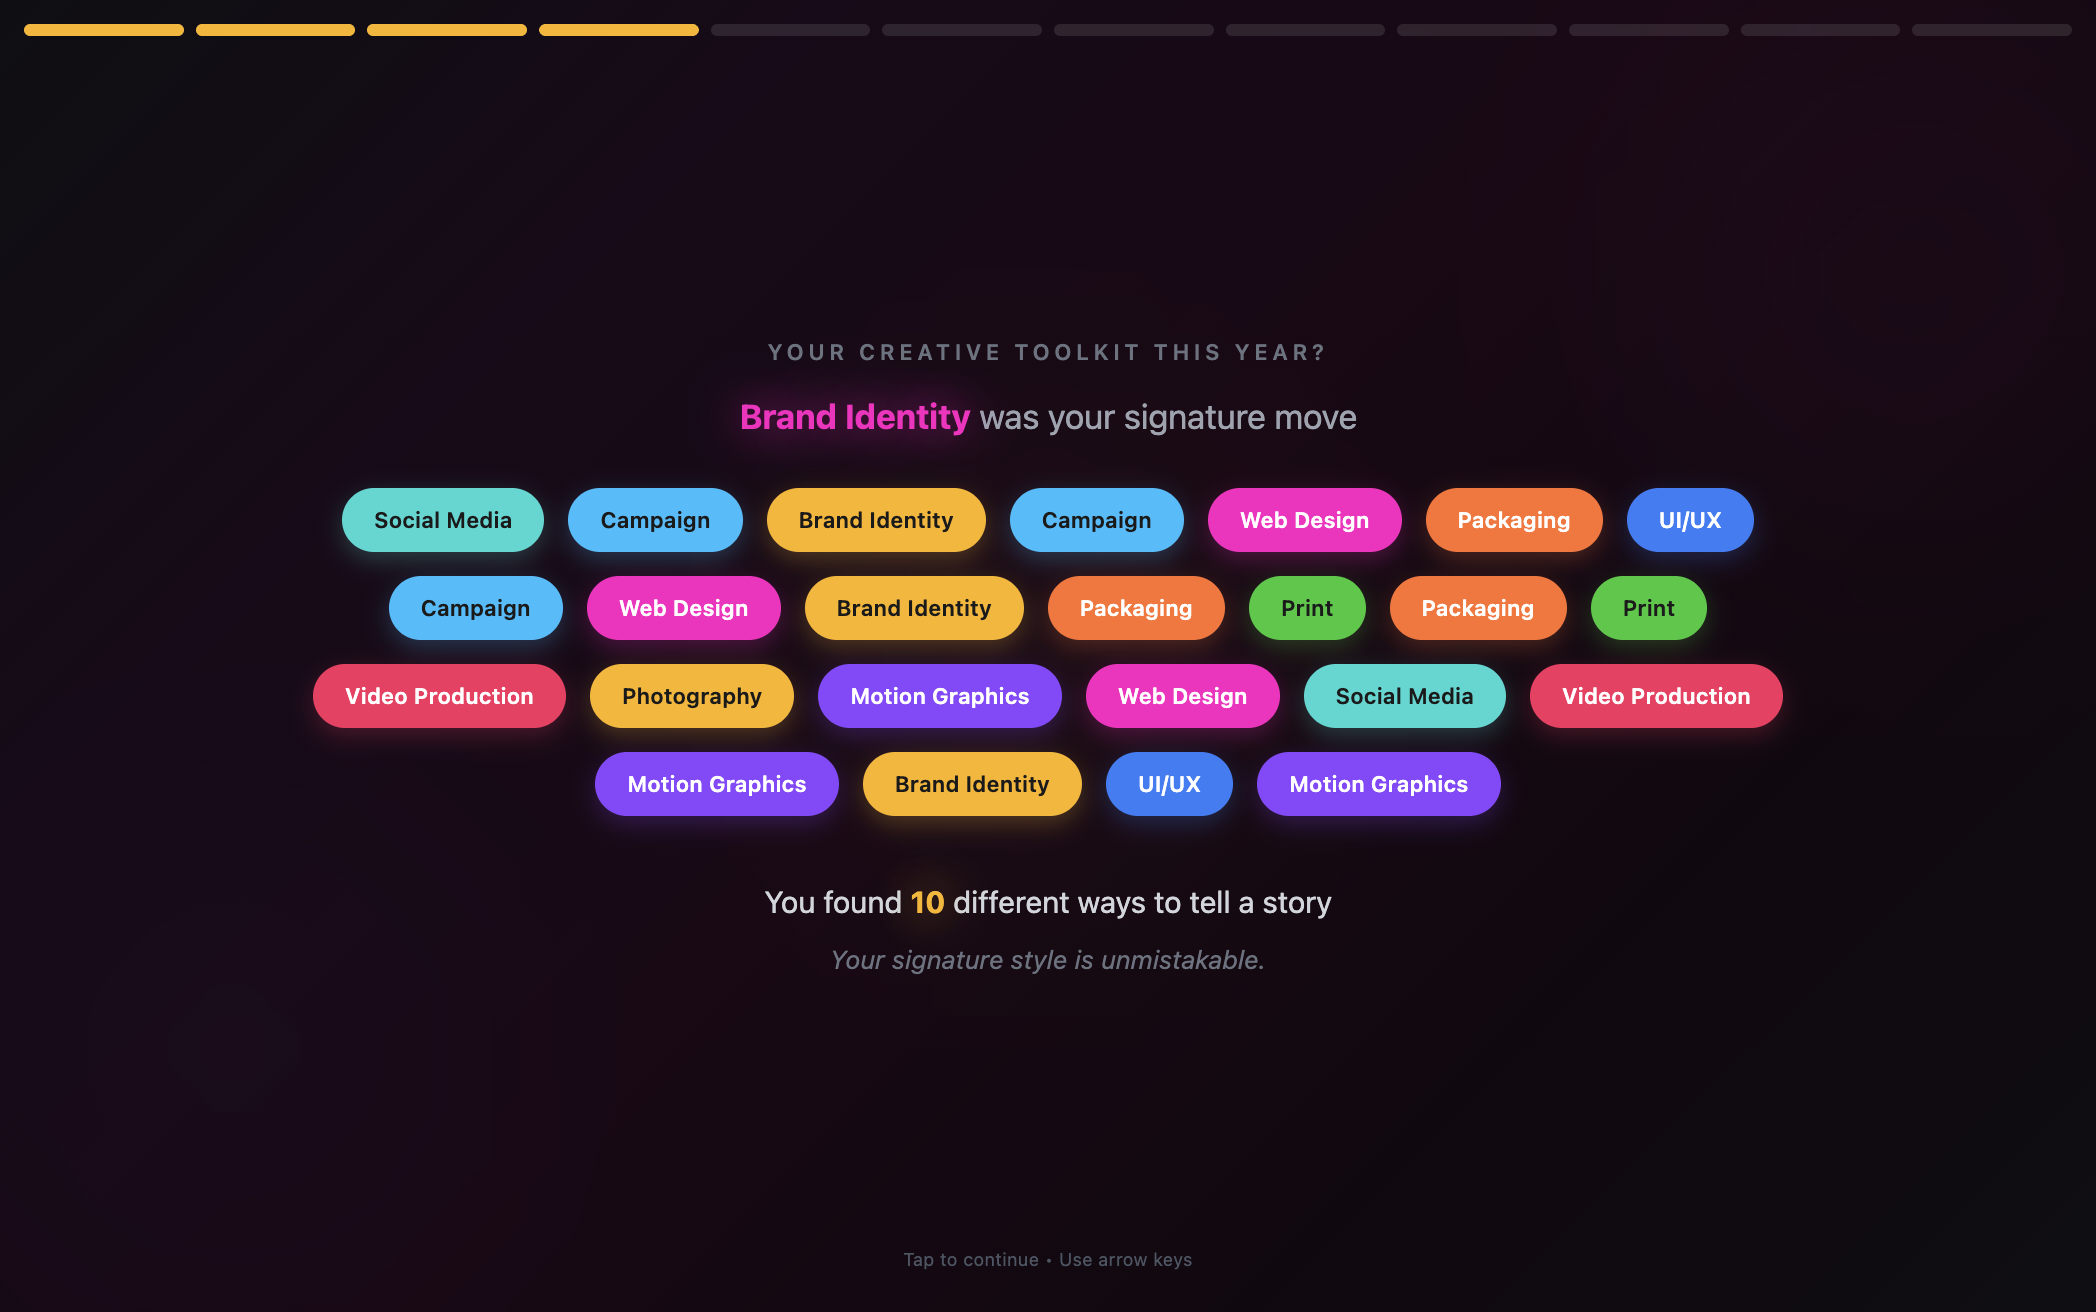
4. Portfolio
Creative toolkit showcase with animated pill tags. Displays the different types of work/approaches used throughout the year.
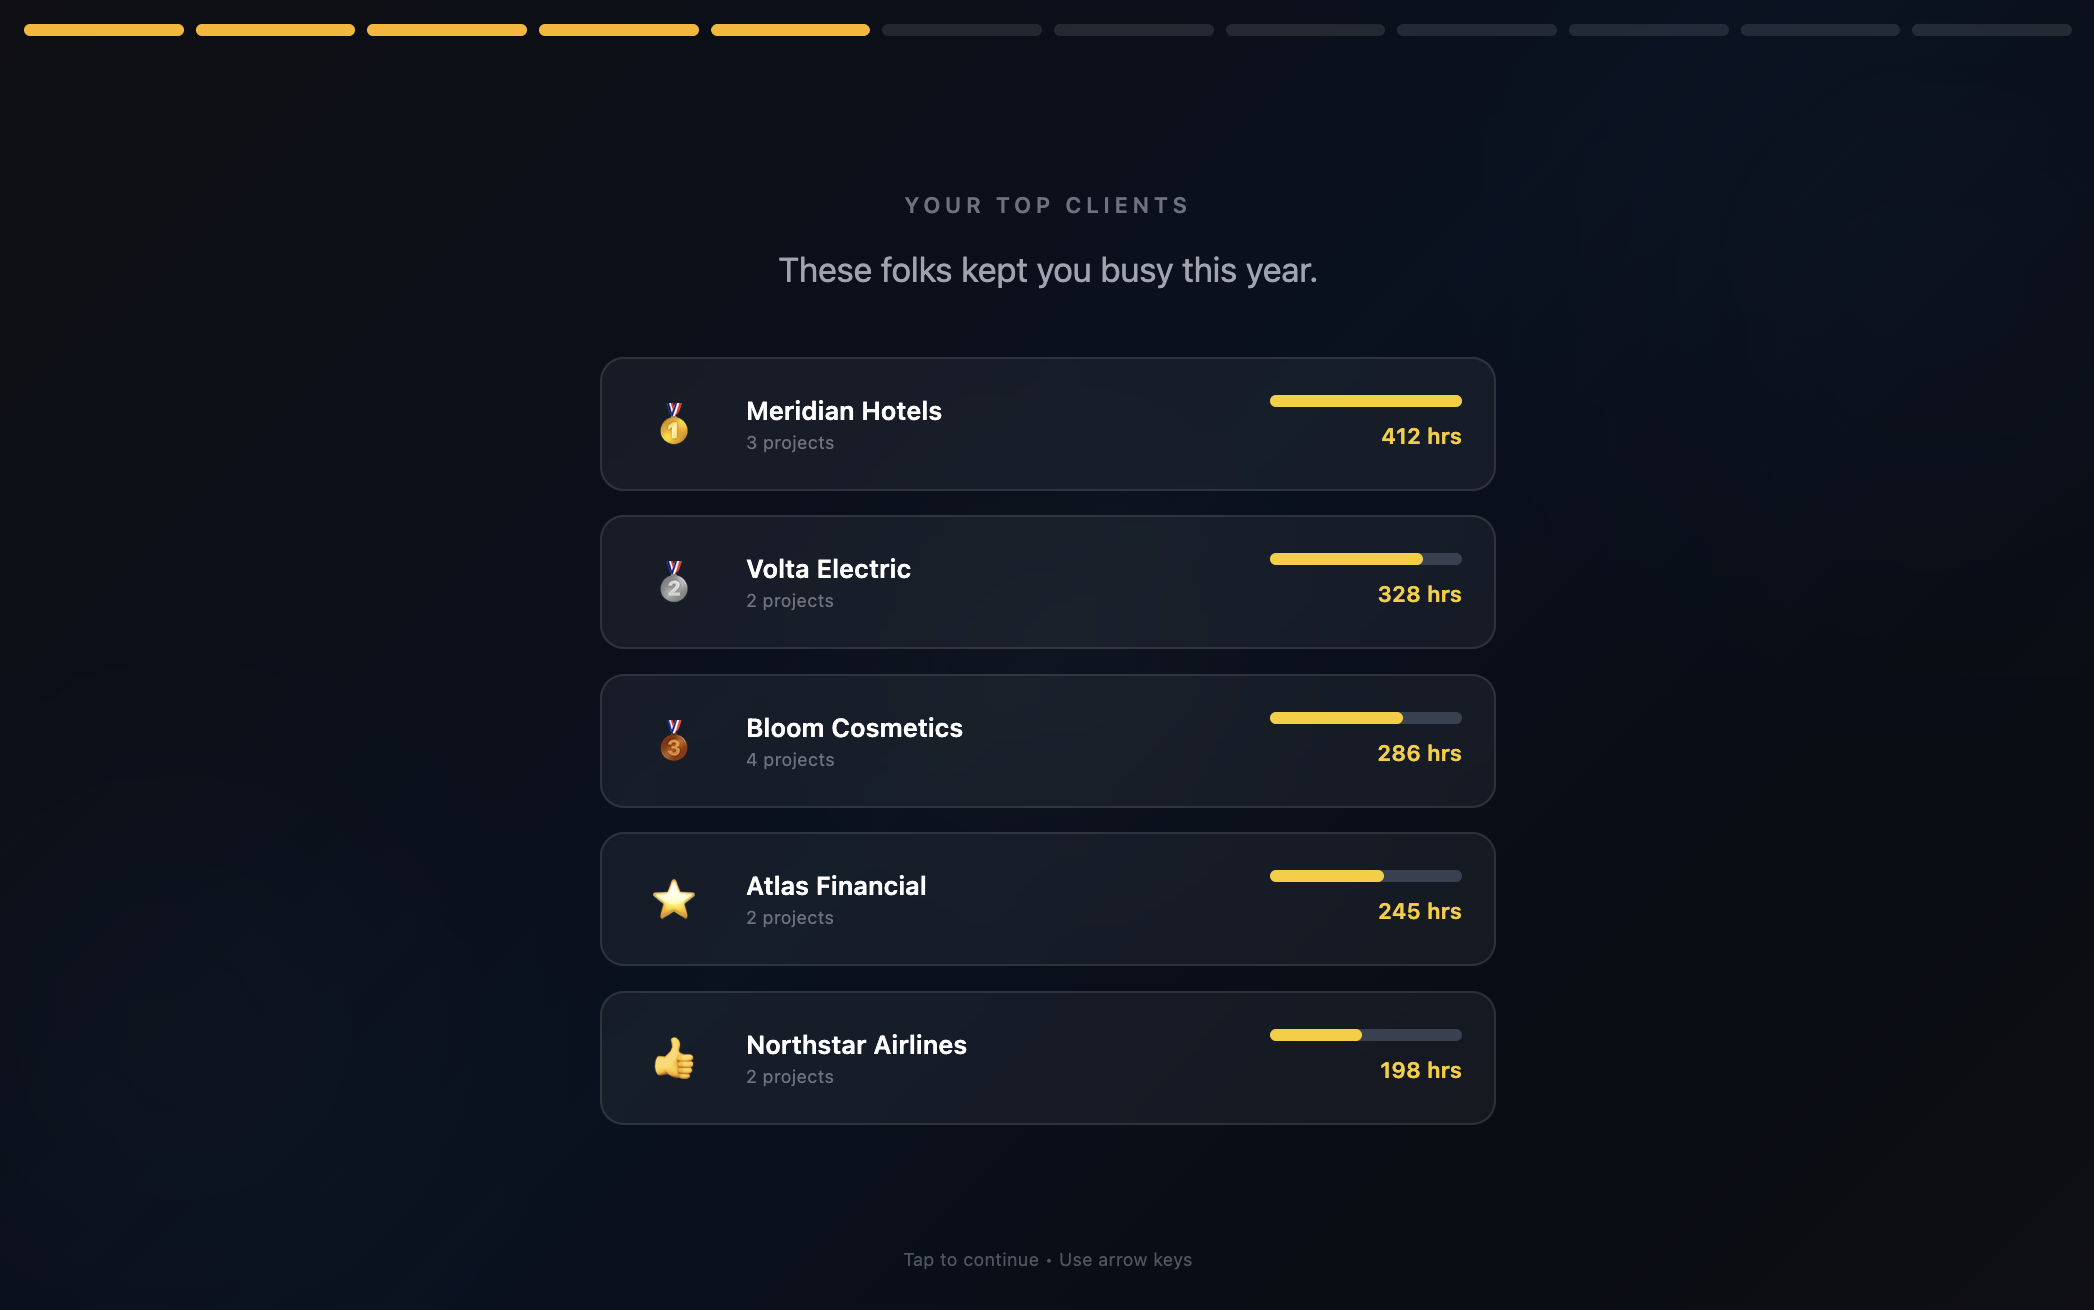
5. Top Clients
Ranked list of top clients with progress bars showing hours invested. Displays project count per client with visual hierarchy.
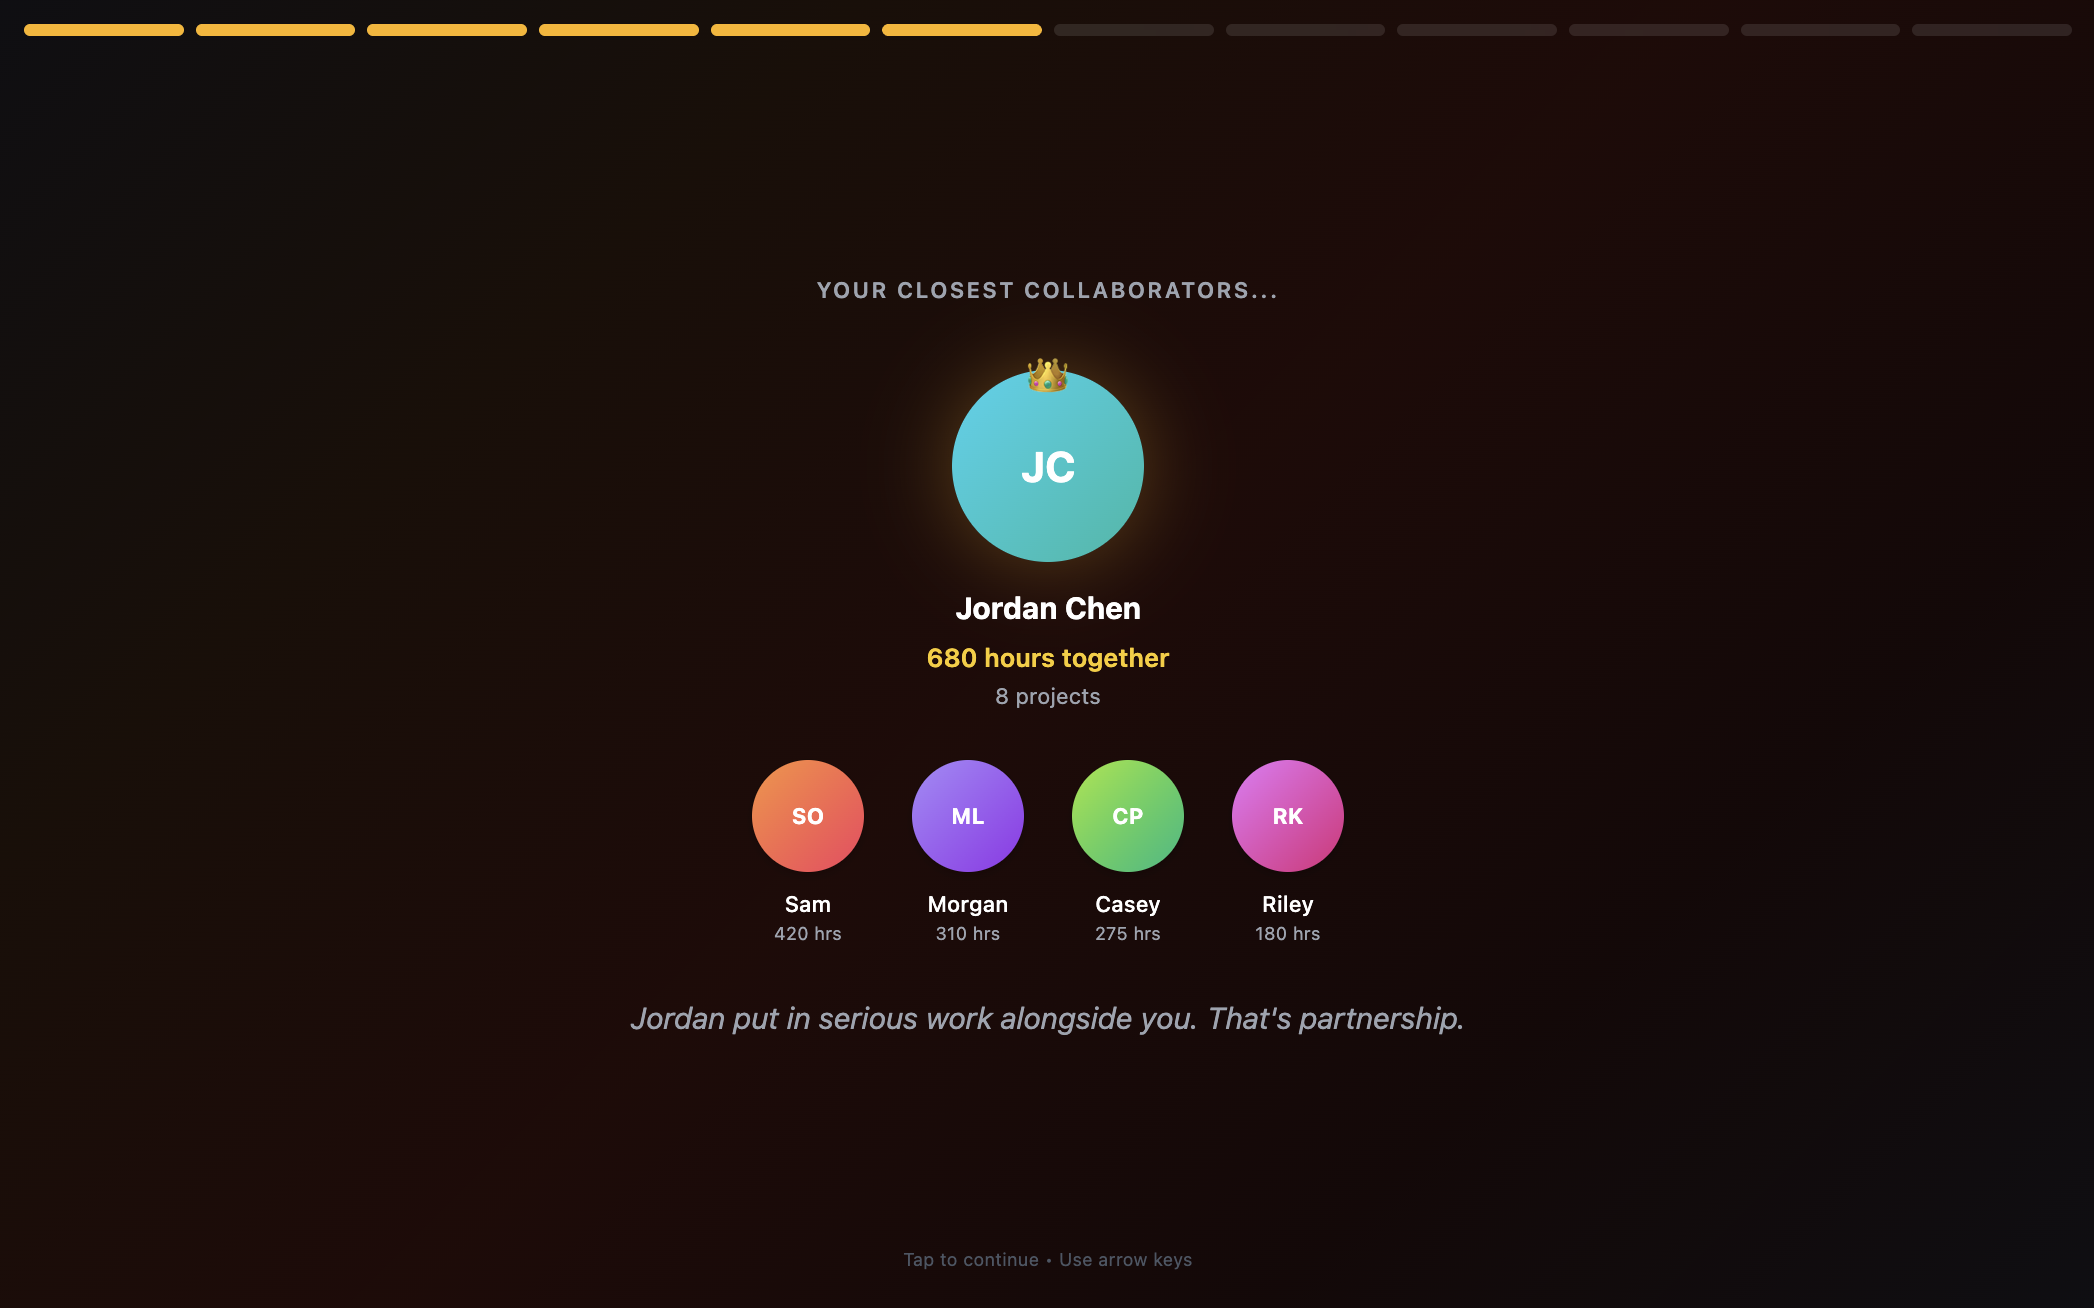
6. Collaborators
Team connection visualization showing colleagues you worked with most. Displays shared hours and project count with avatar initials.
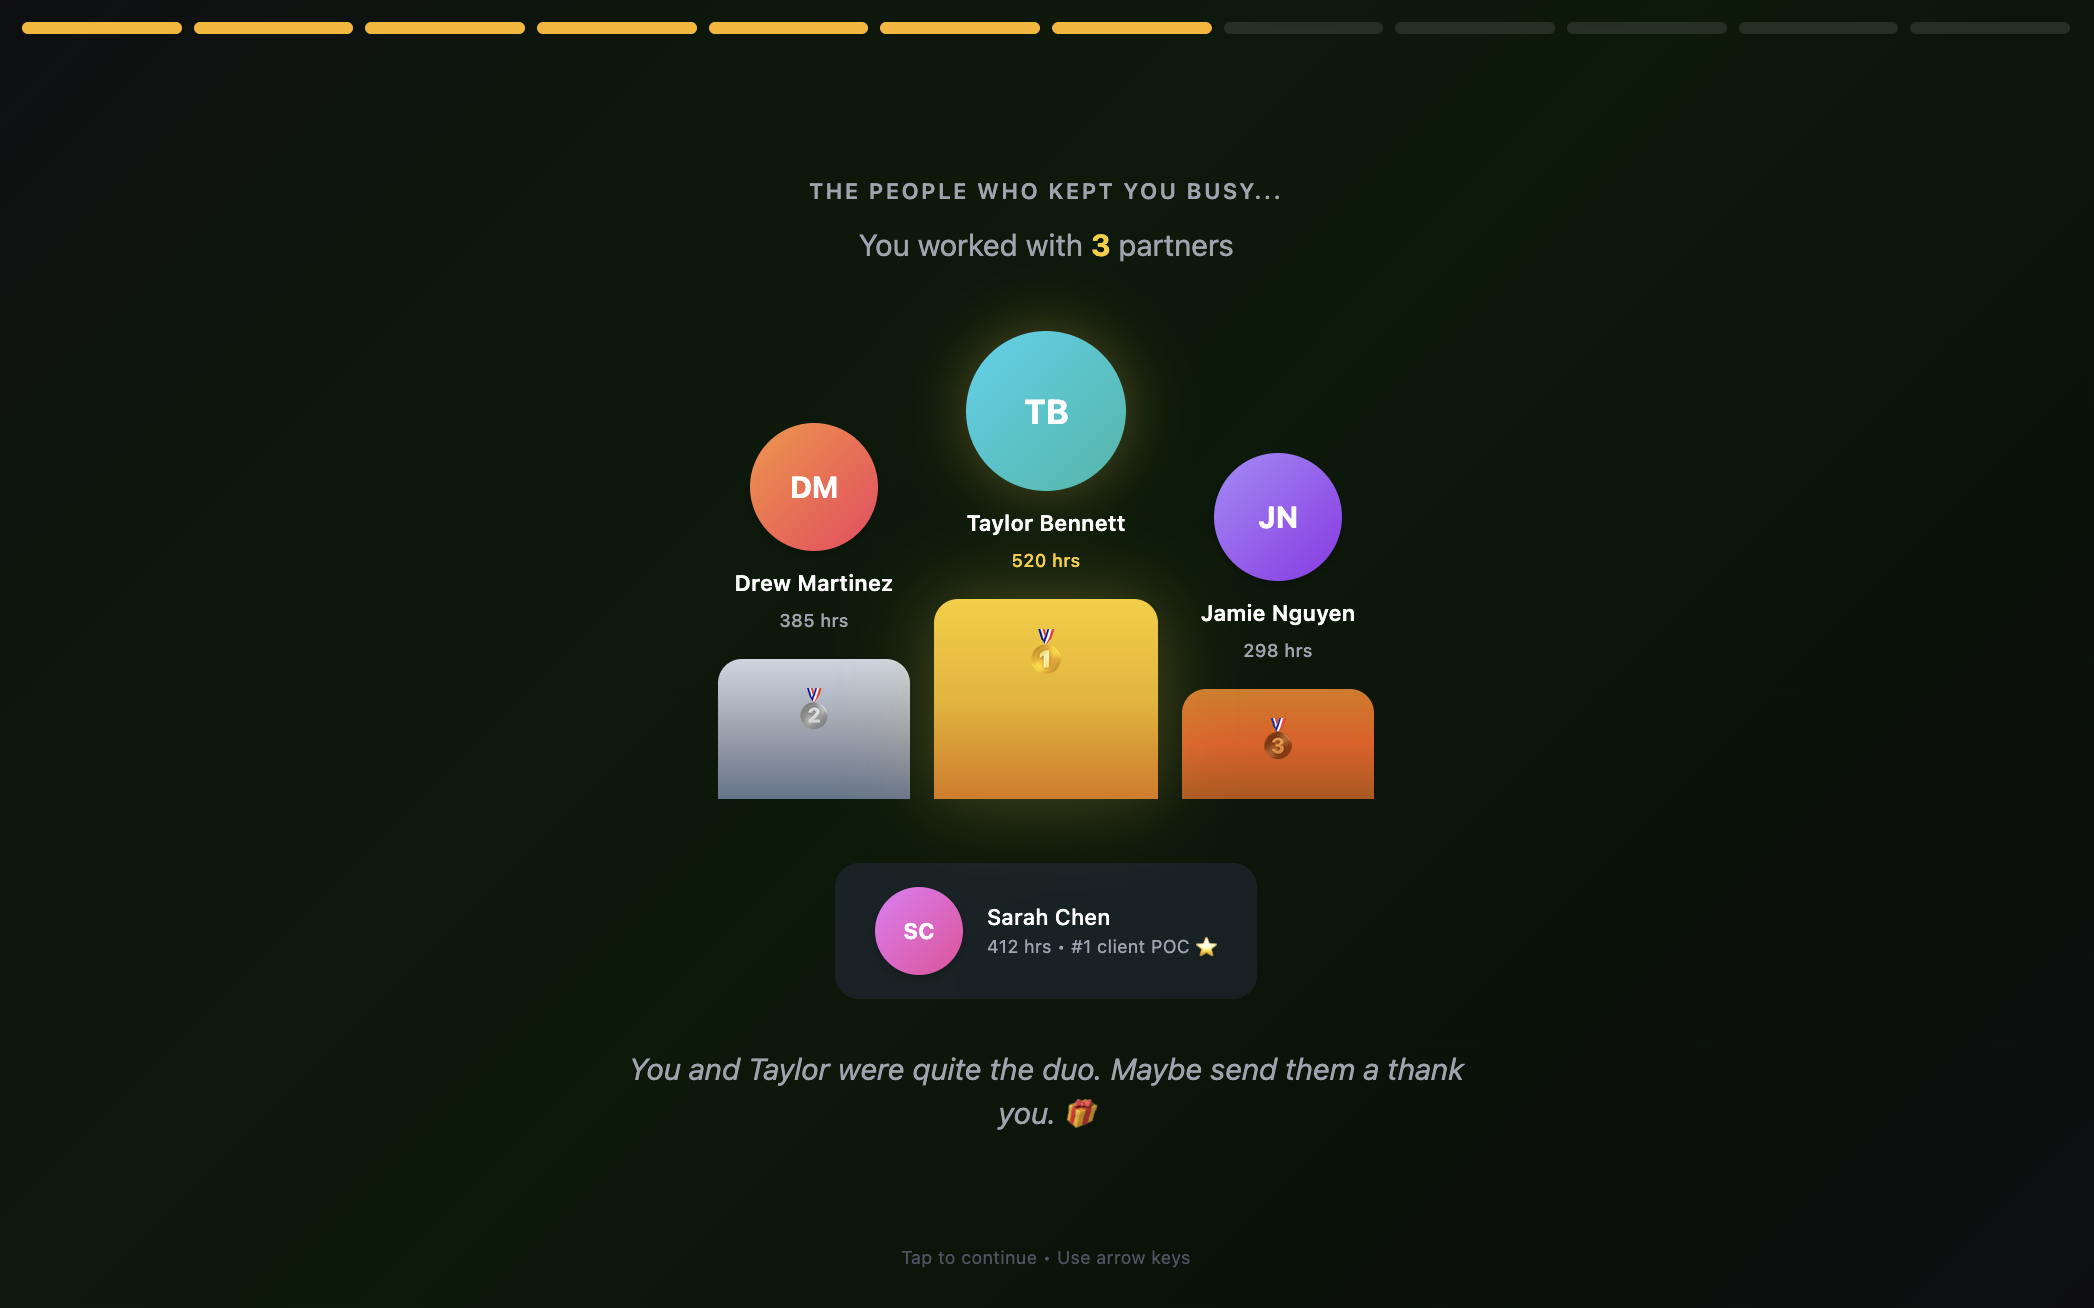
7. Project Leads
Olympic-style podium showing the partners/leads you worked with. Includes hover tooltips with project details.
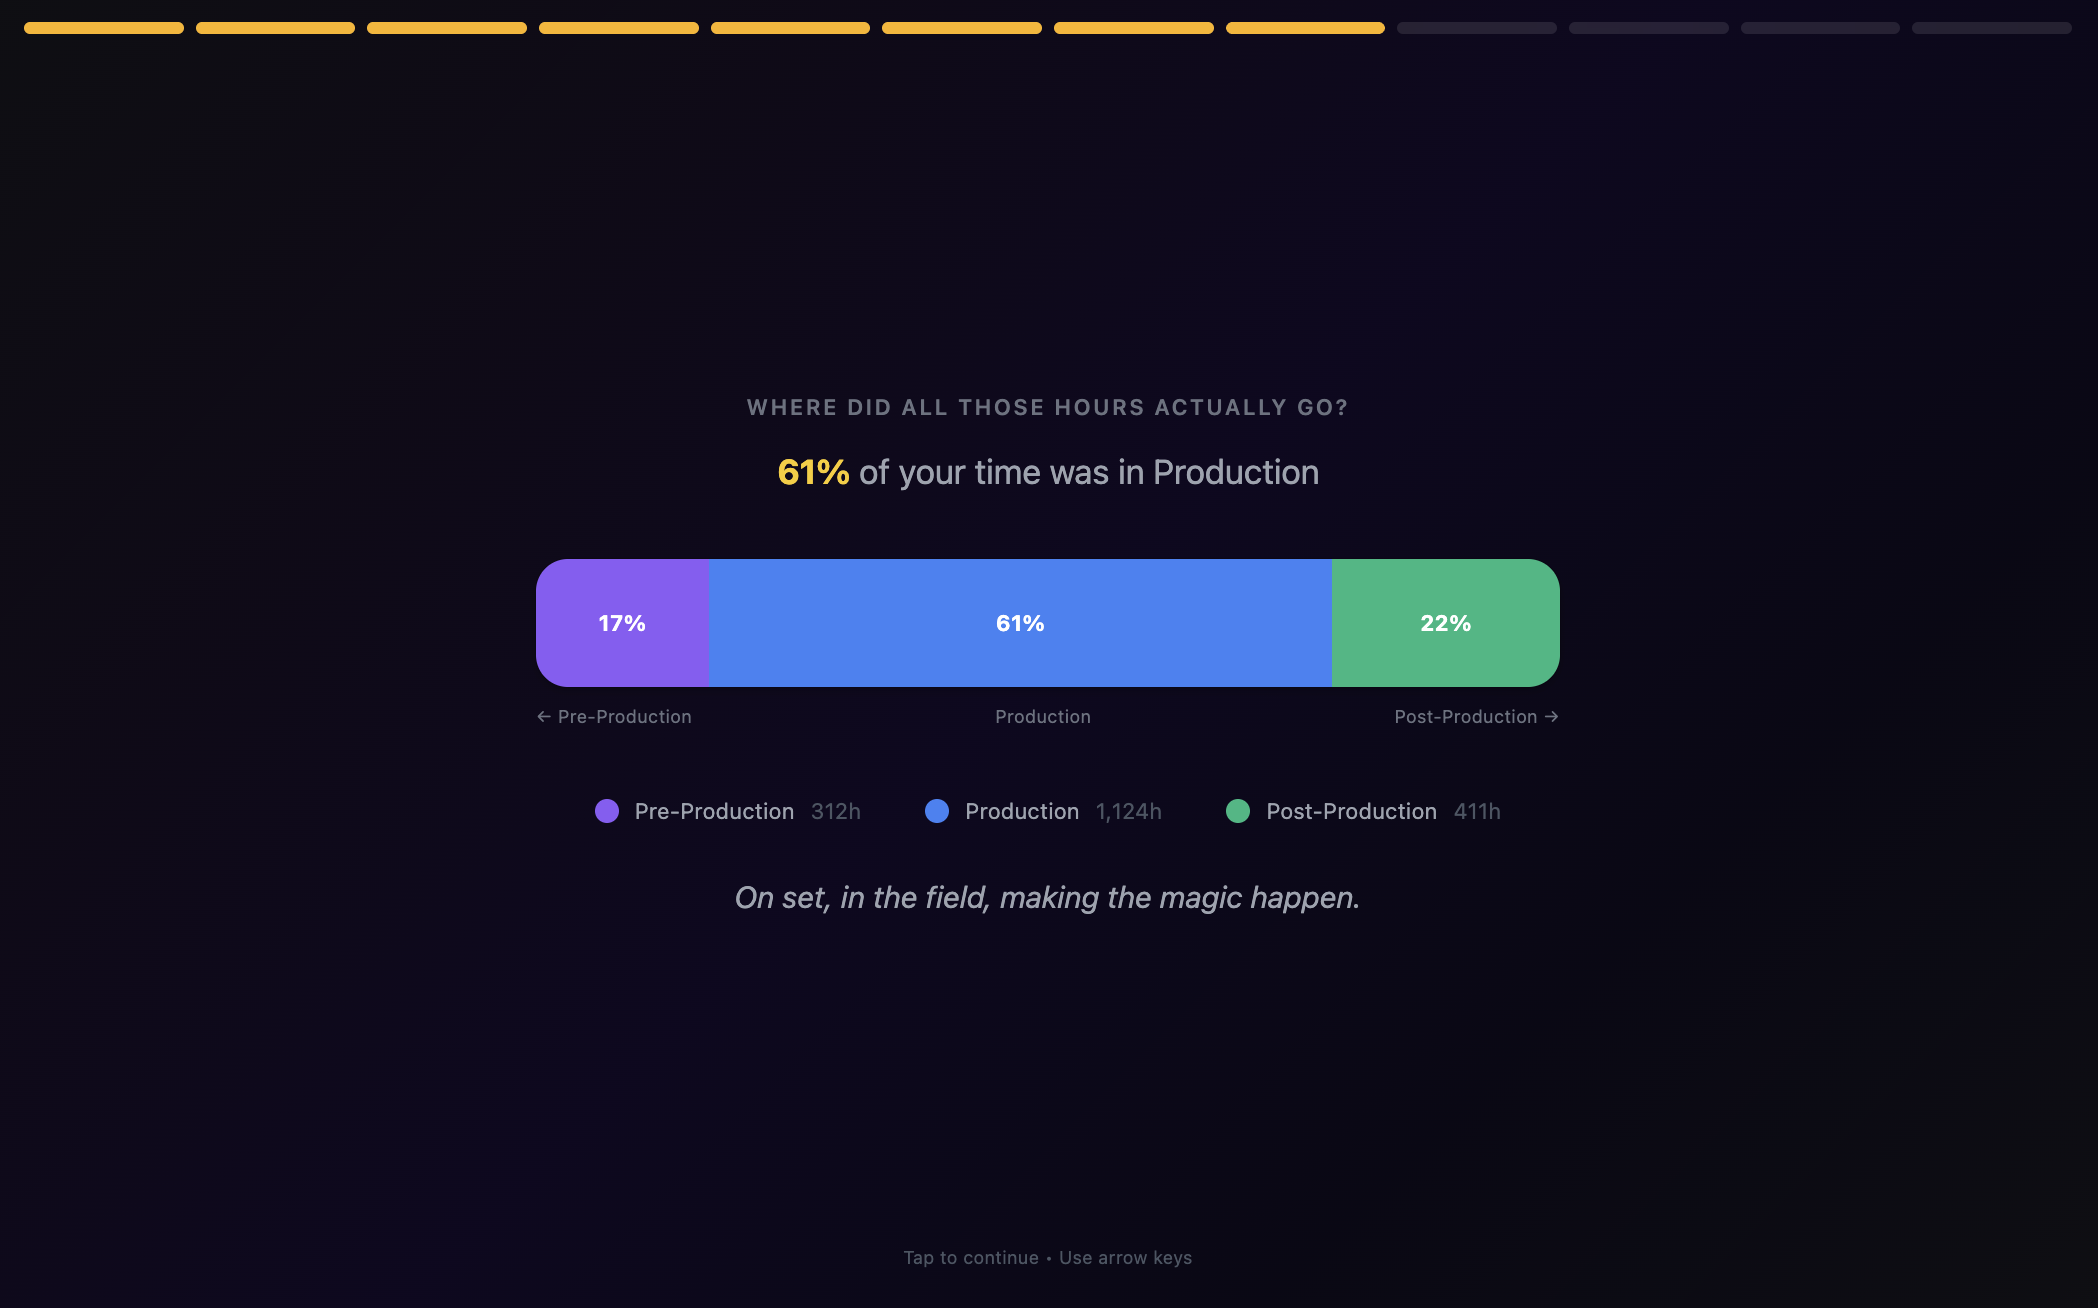
8. Phase Breakdown
Horizontal stacked bar showing time distribution across Pre-Production, Production, and Post-Production phases.
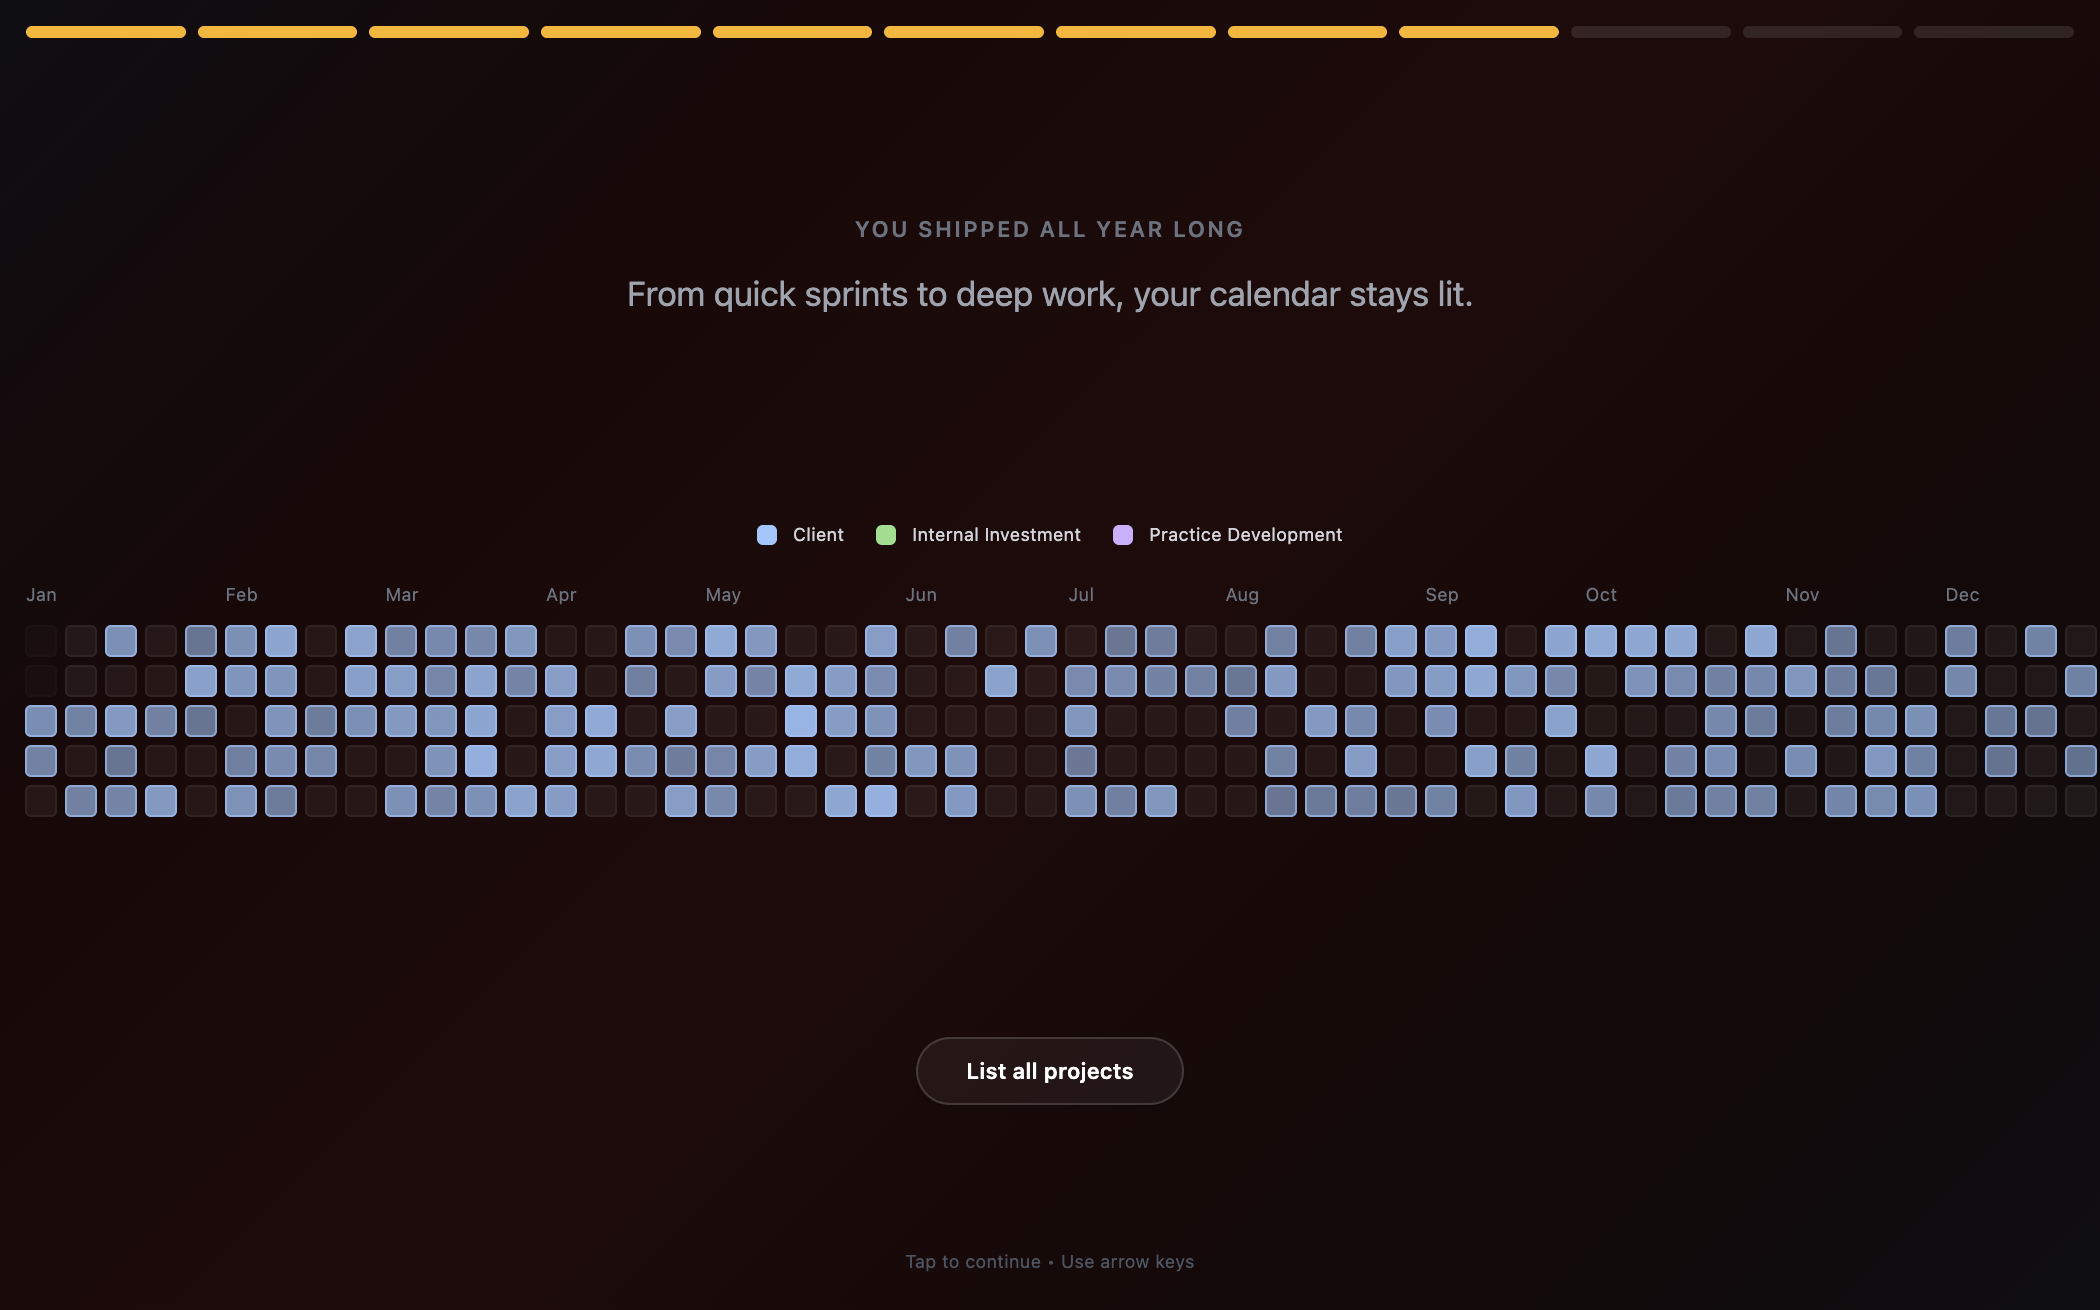
9. Project Heatmap
GitHub-style activity heatmap showing daily work throughout the year. Color-coded by work type with hover tooltips for daily details.
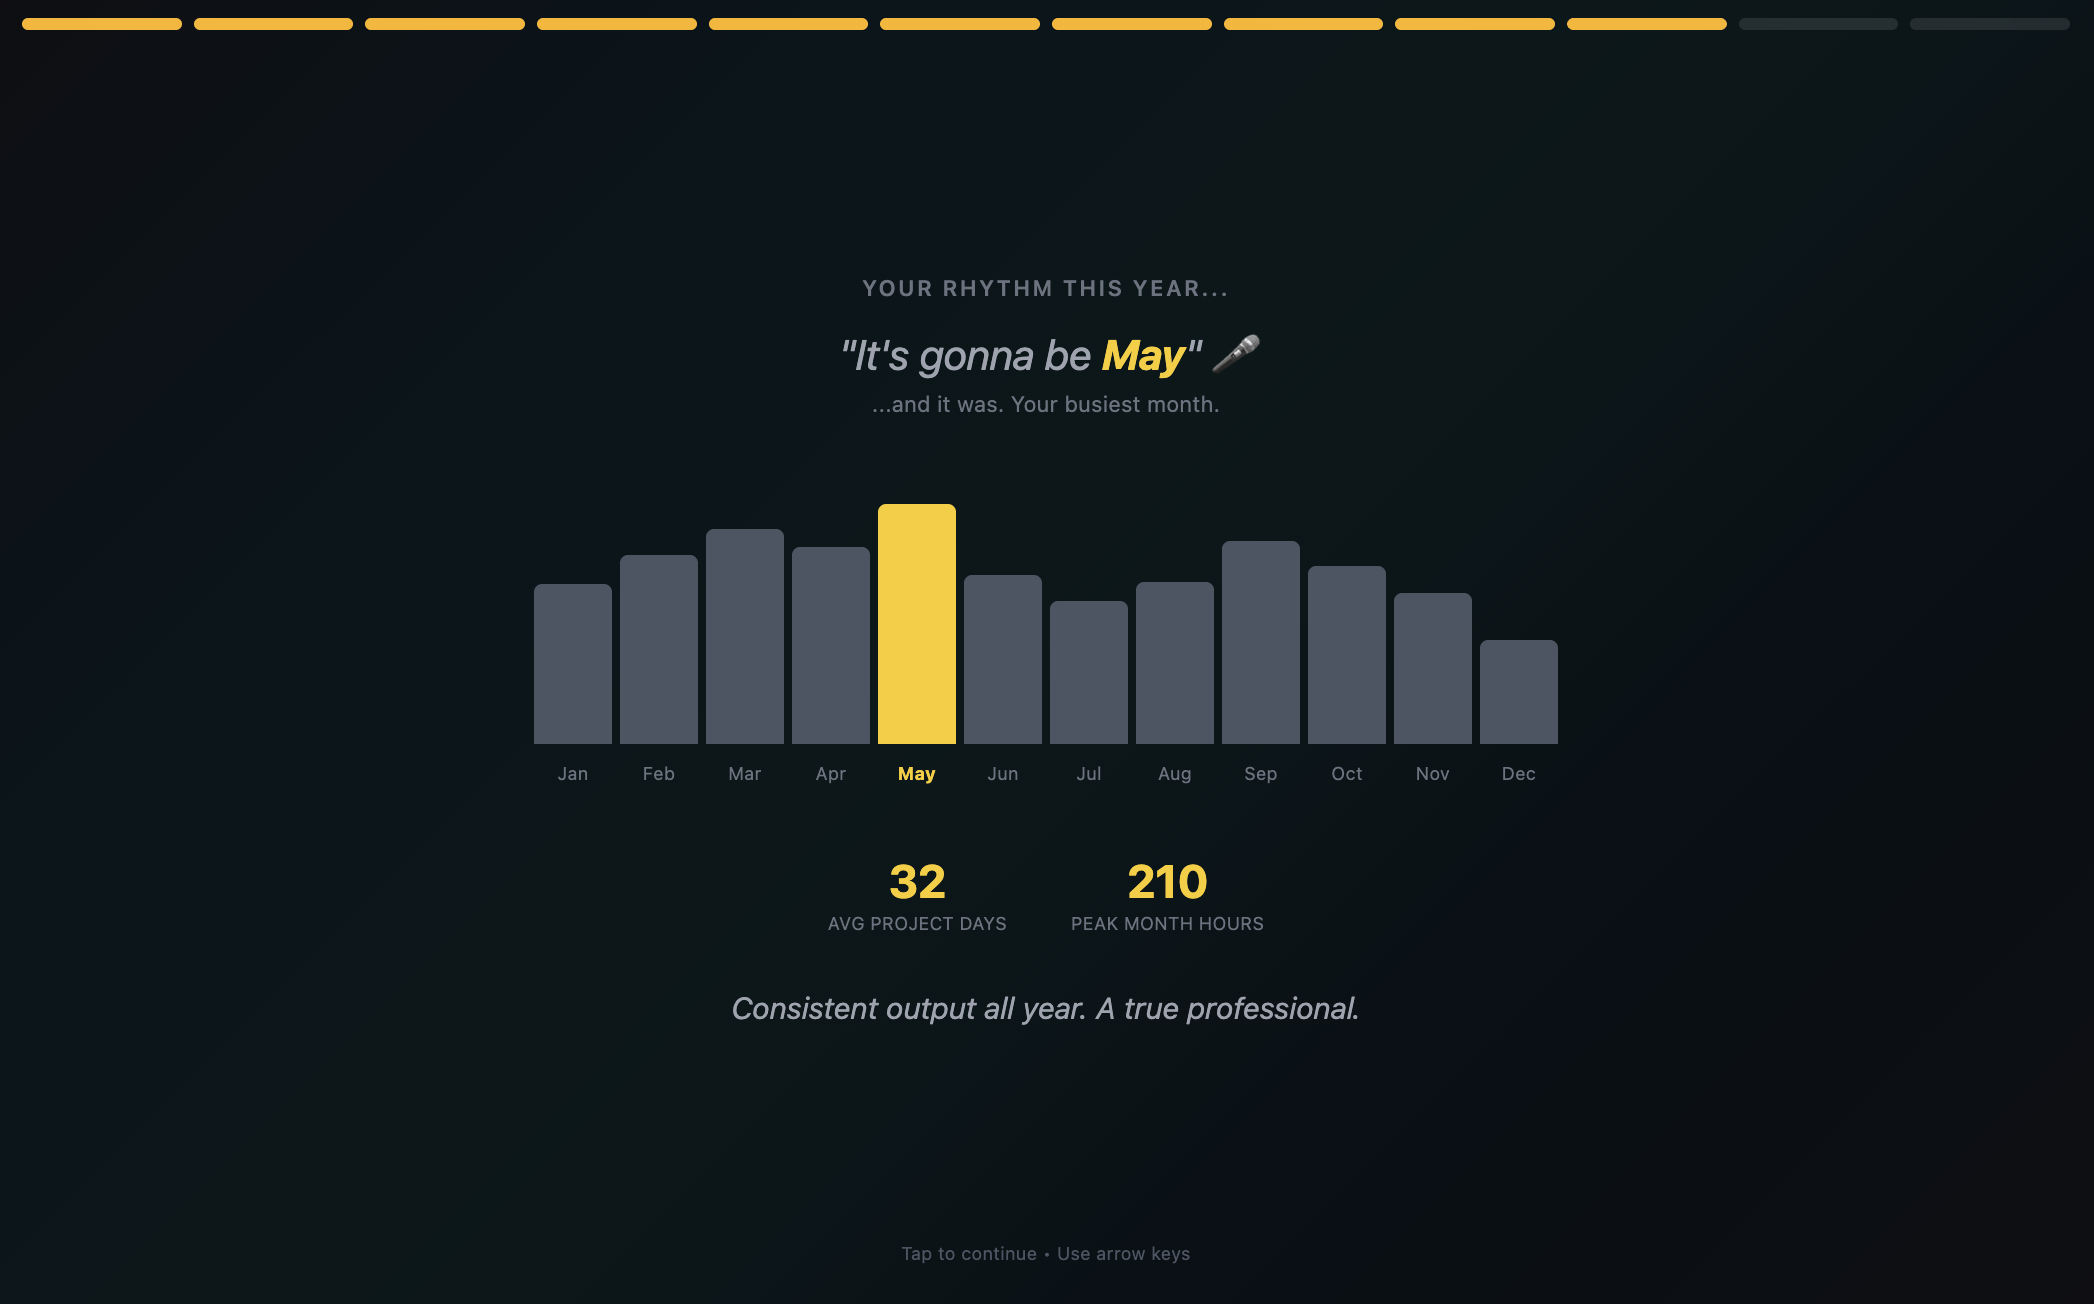
10. Tempo
Monthly work rhythm bar chart showing hours logged per month. Highlights busiest and slowest periods with visual peaks and valleys.
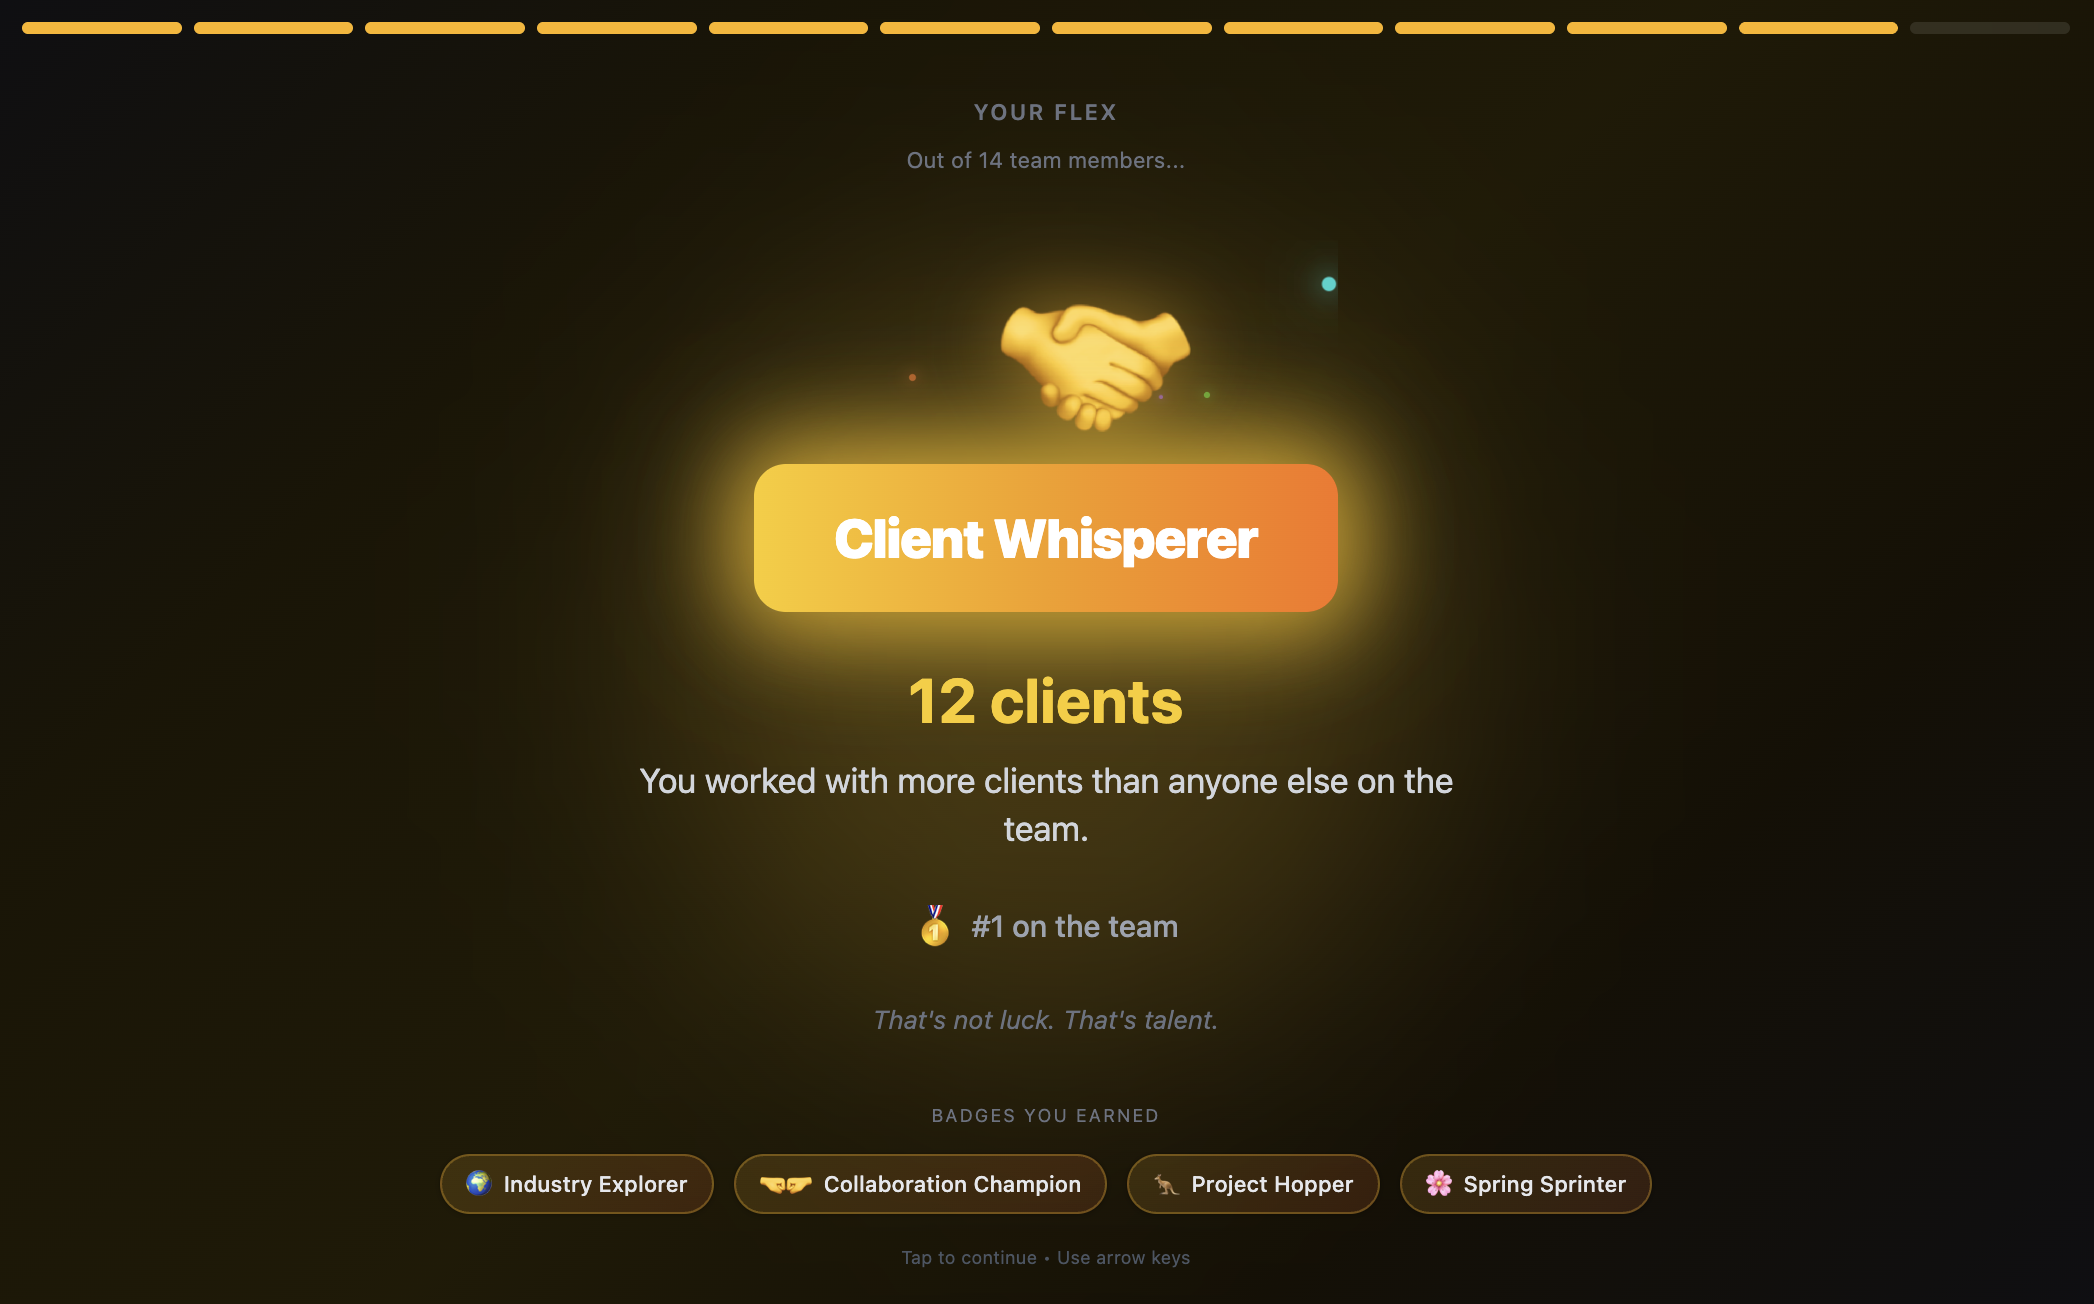
11. Your Moment
Personal achievement spotlight featuring earned badges and superlatives. Shows #1 rankings and unique accomplishments with glow effects.
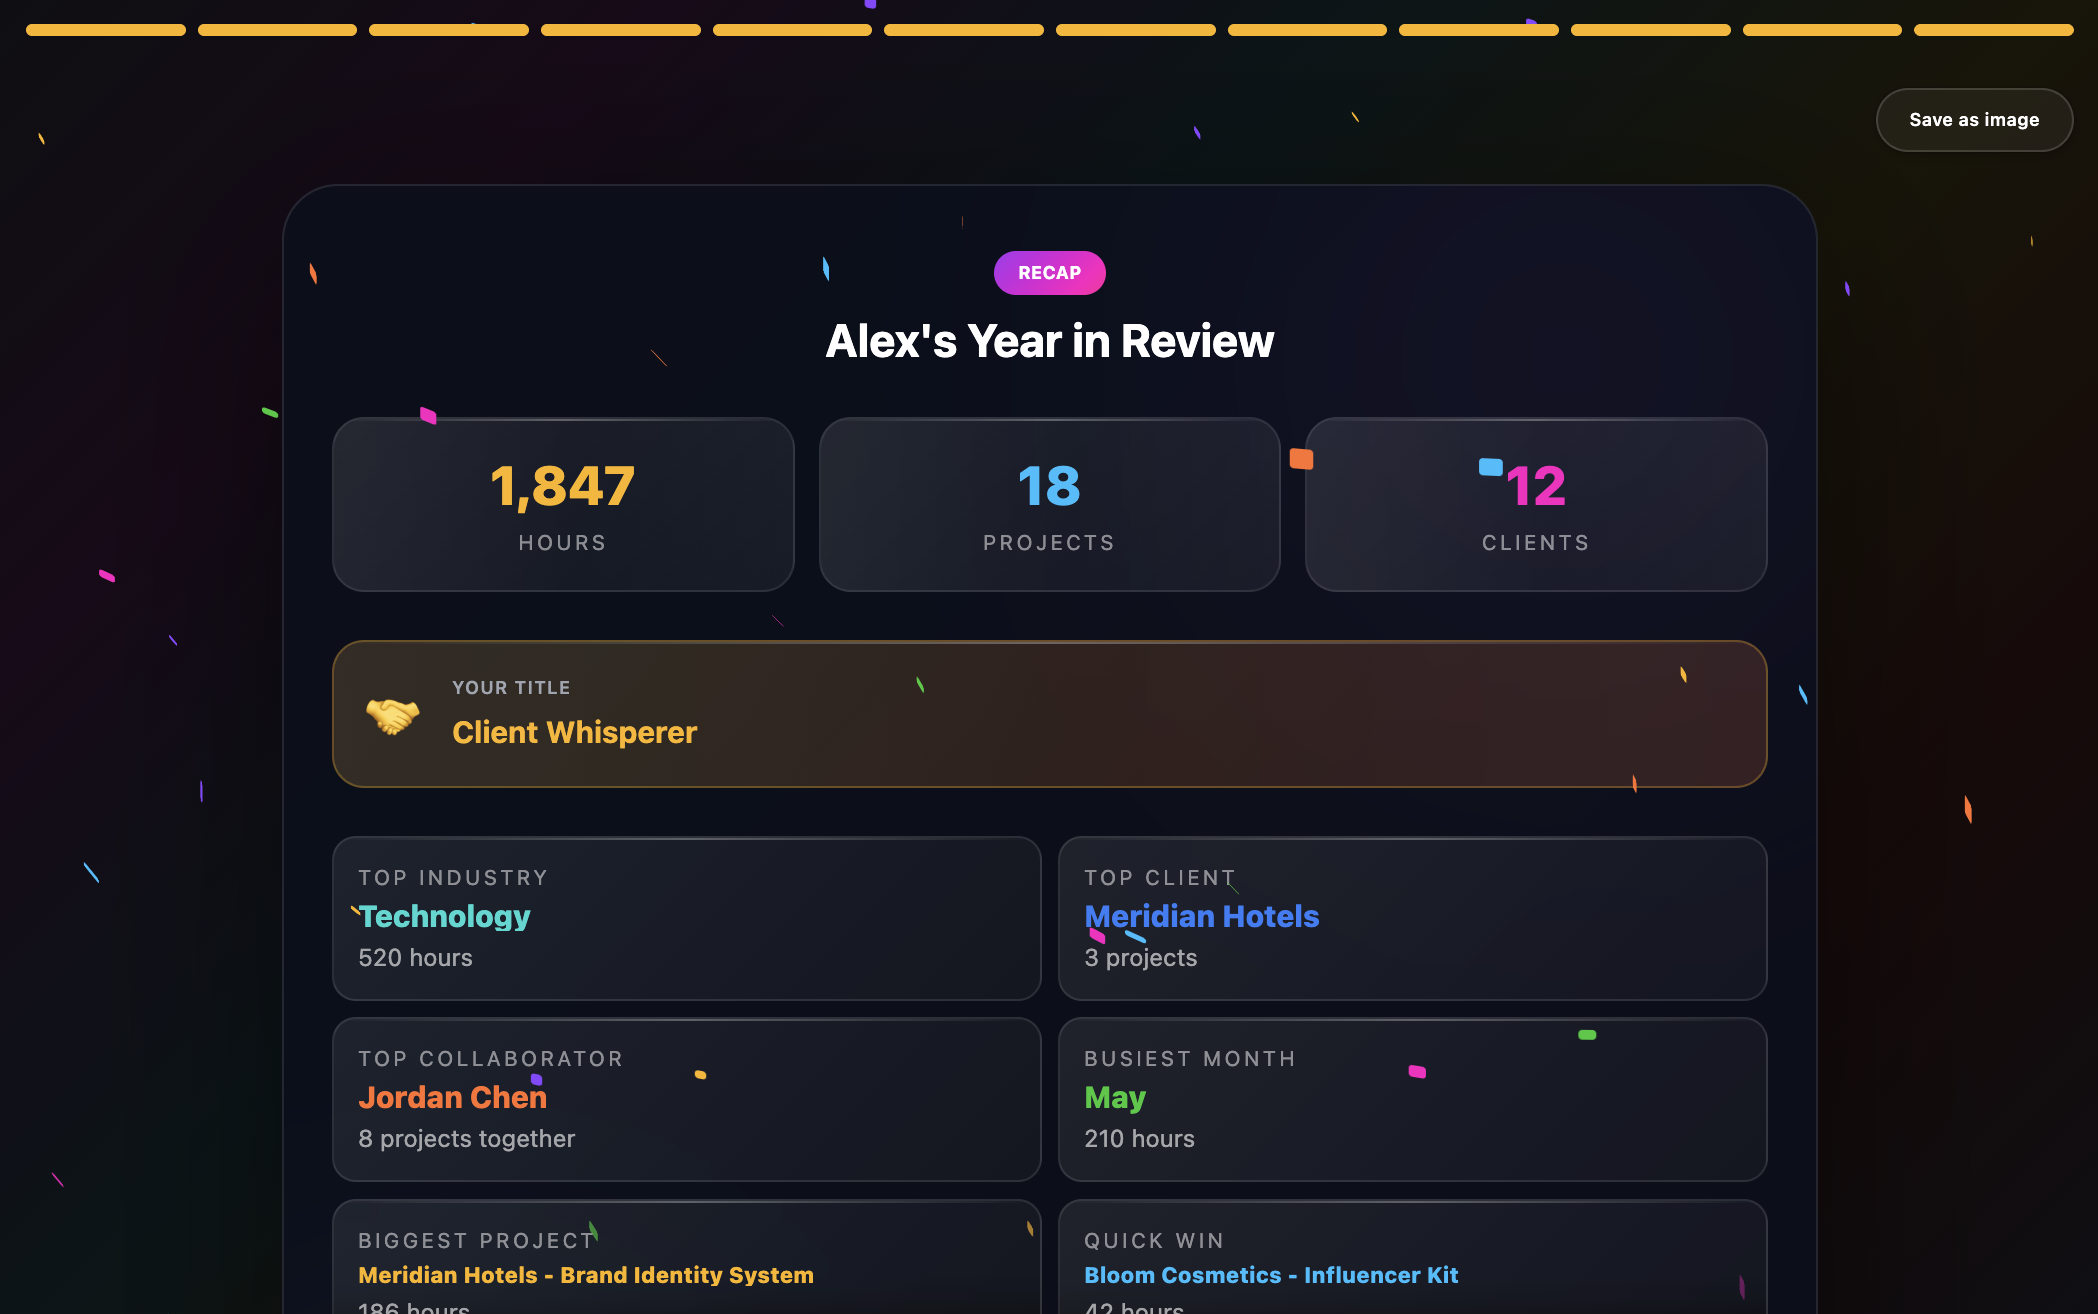
12. Close
Summary card with celebratory confetti animation. Includes option to export slides as PNG images for sharing.
The Achievement System
One of the more fun parts to build was automatic achievement detection. The app analyzes your stats and awards badges like:
- Marathon Maker - 2000+ hours logged
- Project Hopper - 15+ projects in a year
- Team Player - Collaborated with 25+ people
- Year-End Warrior - Strong November-December finish
- Client Whisperer - 50%+ of hours with a single client
These thresholds are all configurable in utils/achievementEngine.js, so teams can create achievements that match their culture.
Technical Approach
Built as an Airtable Block using their Interface SDK. The frontend is React with custom hooks for settings management and data fetching. Data aggregation happens client-side through a stats calculation engine that handles time filtering, grouping, and rollups.
The architecture prioritizes customization. A schema export script generates AI-friendly documentation of your Airtable base, making it easy to use Claude or Cursor to adapt the field mappings to your specific setup.
Core Technologies
- Airtable Blocks SDK
- React with custom hooks
- CSS animations (confetti, sparkles, floating orbs, word reveals)
- Node.js for schema export tooling
Reusable Components
All animation components can be used in your own slides:
import { Sparkles, AnimatedNumber, WordReveal, GlowText } from './components/shared';

// Sparkle effects
<Sparkles count={20} colors={['#FF6F2C', '#8B46FF']} />

// Animated counters
<AnimatedNumber value={1234} suffix=" hrs" glow />

// Text reveal animation
<WordReveal text="Your Year in Review" delay={300} />

// Glowing emphasis
<GlowText color="#FCB400">2,500 hours</GlowText>
Demo Mode
Want to see it in action? Enable demo mode to view sample data for a fictional creative agency:
// In frontend/config.js, set:
export const DEMO_MODE = true
The demo includes a full year of work data for “Alex Rivera” at “Stellar Studios”—complete with clients, collaborators, project leads, and achievements.
Built for year-end celebrations.